Entity Workflow
The Entity Workflow transforms threat investigation by shifting the focus from disconnected alerts to compromised network entities. Accessed using the default Dashboard | Security tab, the workflow centers on the Highest-risk Entities panel. This panel serves as your daily starting point by identifying the top priority network entities that require attention.
To accelerate the initial assessment, these top priority entities are automatically triaged every 24 hours. Each entity is ranked by a triage confidence score alongside an AI Insight verdict (such as “Needs Human Review”), allowing analysts to quickly identify orchestrated campaigns and critical threats at a glance.
Beyond initial prioritization, the workflow provides a structured path for full incident resolution. Analysts can transition from the main dashboard into the Entity Overview to perform deep-dive analysis, validate AI-generated findings against raw network logs, and plan response actions, which can include executing remote containment commands through integrated endpoint platforms.
Note
The Entity Workflow is a core capability of Investigator and is available to all users. However, many of the advanced summaries, playbooks, and evidence-gathering features in this workflow are powered by Agentic Triage.
Throughout this guide, steps or UI elements that require this Agentic Triage are marked with an [AI] tag or an AI icon. These specific insights are only visible if the GPT (Private data) integration is enabled by your administrator.
Advantages of Agentic Triage
This workflow is driven by Agentic Triage, an automated threat hunter that performs the initial investigation for you. Agentic Triage uses a multi-agent architecture to mimic a team of expert analysts, ensuring every finding in your queue is grounded in verifiable network evidence.
The system transforms raw alerts and network data into clear, AI-generated summaries centered on the Entity. This gives you these critical advantages:
Start your investigation triaged: Each day, the system identifies and investigates the top priority entities based on their aggregate alert activity, severity, and open status. Instead of triaging individual alerts, you begin your investigations with a prioritized list of compromised hosts or domains.
Reduced noise: By grouping related alerts into a single entity-based detection, the system filters out low-fidelity noise. This allows you to see the “big picture” of how an entity is behaving across the network rather than sifting through disconnected event logs.
Evidence-backed findings: Agentic Triage profiles each entity to establish a behavioral baseline and identify outliers. Every conclusion is backed by verifiable proof, such as specific log entries associated with that host so you can independently confirm exactly why an entity was flagged.
For more details on how this automated investigation process works, see the Agentic Triage topic.
Note
Content accompanied by the AI icon is generated by Corelight AI using a large language model. Because an AI algorithm generates this content, there might be errors or omissions; always use your best judgment to verify findings during your investigations.
Daily success checklist
To get the most out of the Entity Analysis Workflow, build these habits into your daily routine:
Prioritize by Score: Always start your investigation with entities that have a triage confidence Score of 9–10. These represent the highest-risk entities automatically investigated by the system during the last analysis cycle.
Deep Dive into the Entity Overview: Click any entity in the list to open the Entity Overview tab. This workspace consolidates the Analysis Summary with raw forensic telemetry, allowing you to investigate the full scope of an incident in a single view.
Validate AI Findings: Read the Analysis Summary to understand the incident details. Review the Investigation Findings to see the specific threats the AI validated. You can click any finding to open the Key Findings modal, or click View Playbook to audit the AI’s step-by-step logic.
Inspect the evidence: From the Key Findings modal, click View Details to inspect the Associated Evidence. This displays the exact JSON data the AI reasoned over. You can also click View in LogSearch to see the actual query used to gather that telemetry.
Perform containment: Once you have verified a threat, use the EDR Details tab or Recommended Responses panel to take action. This allows you to block IPs or isolate hosts directly through your security integrations.
Clear the queue: Update the Triage Status by closing detections as your investigations conclude. Closing open detections for an entity removes it from the daily top priority list, ensuring the next 24-hour cycle focuses on new, emerging threats.
Note
Agentic Triage accelerates investigations by automating complex data correlation and providing an evidence-backed narrative. However, the system is designed to support, not replace, the analyst, who remains the final authority on all triage and containment decisions.
Navigating the Highest-risk Entities panel
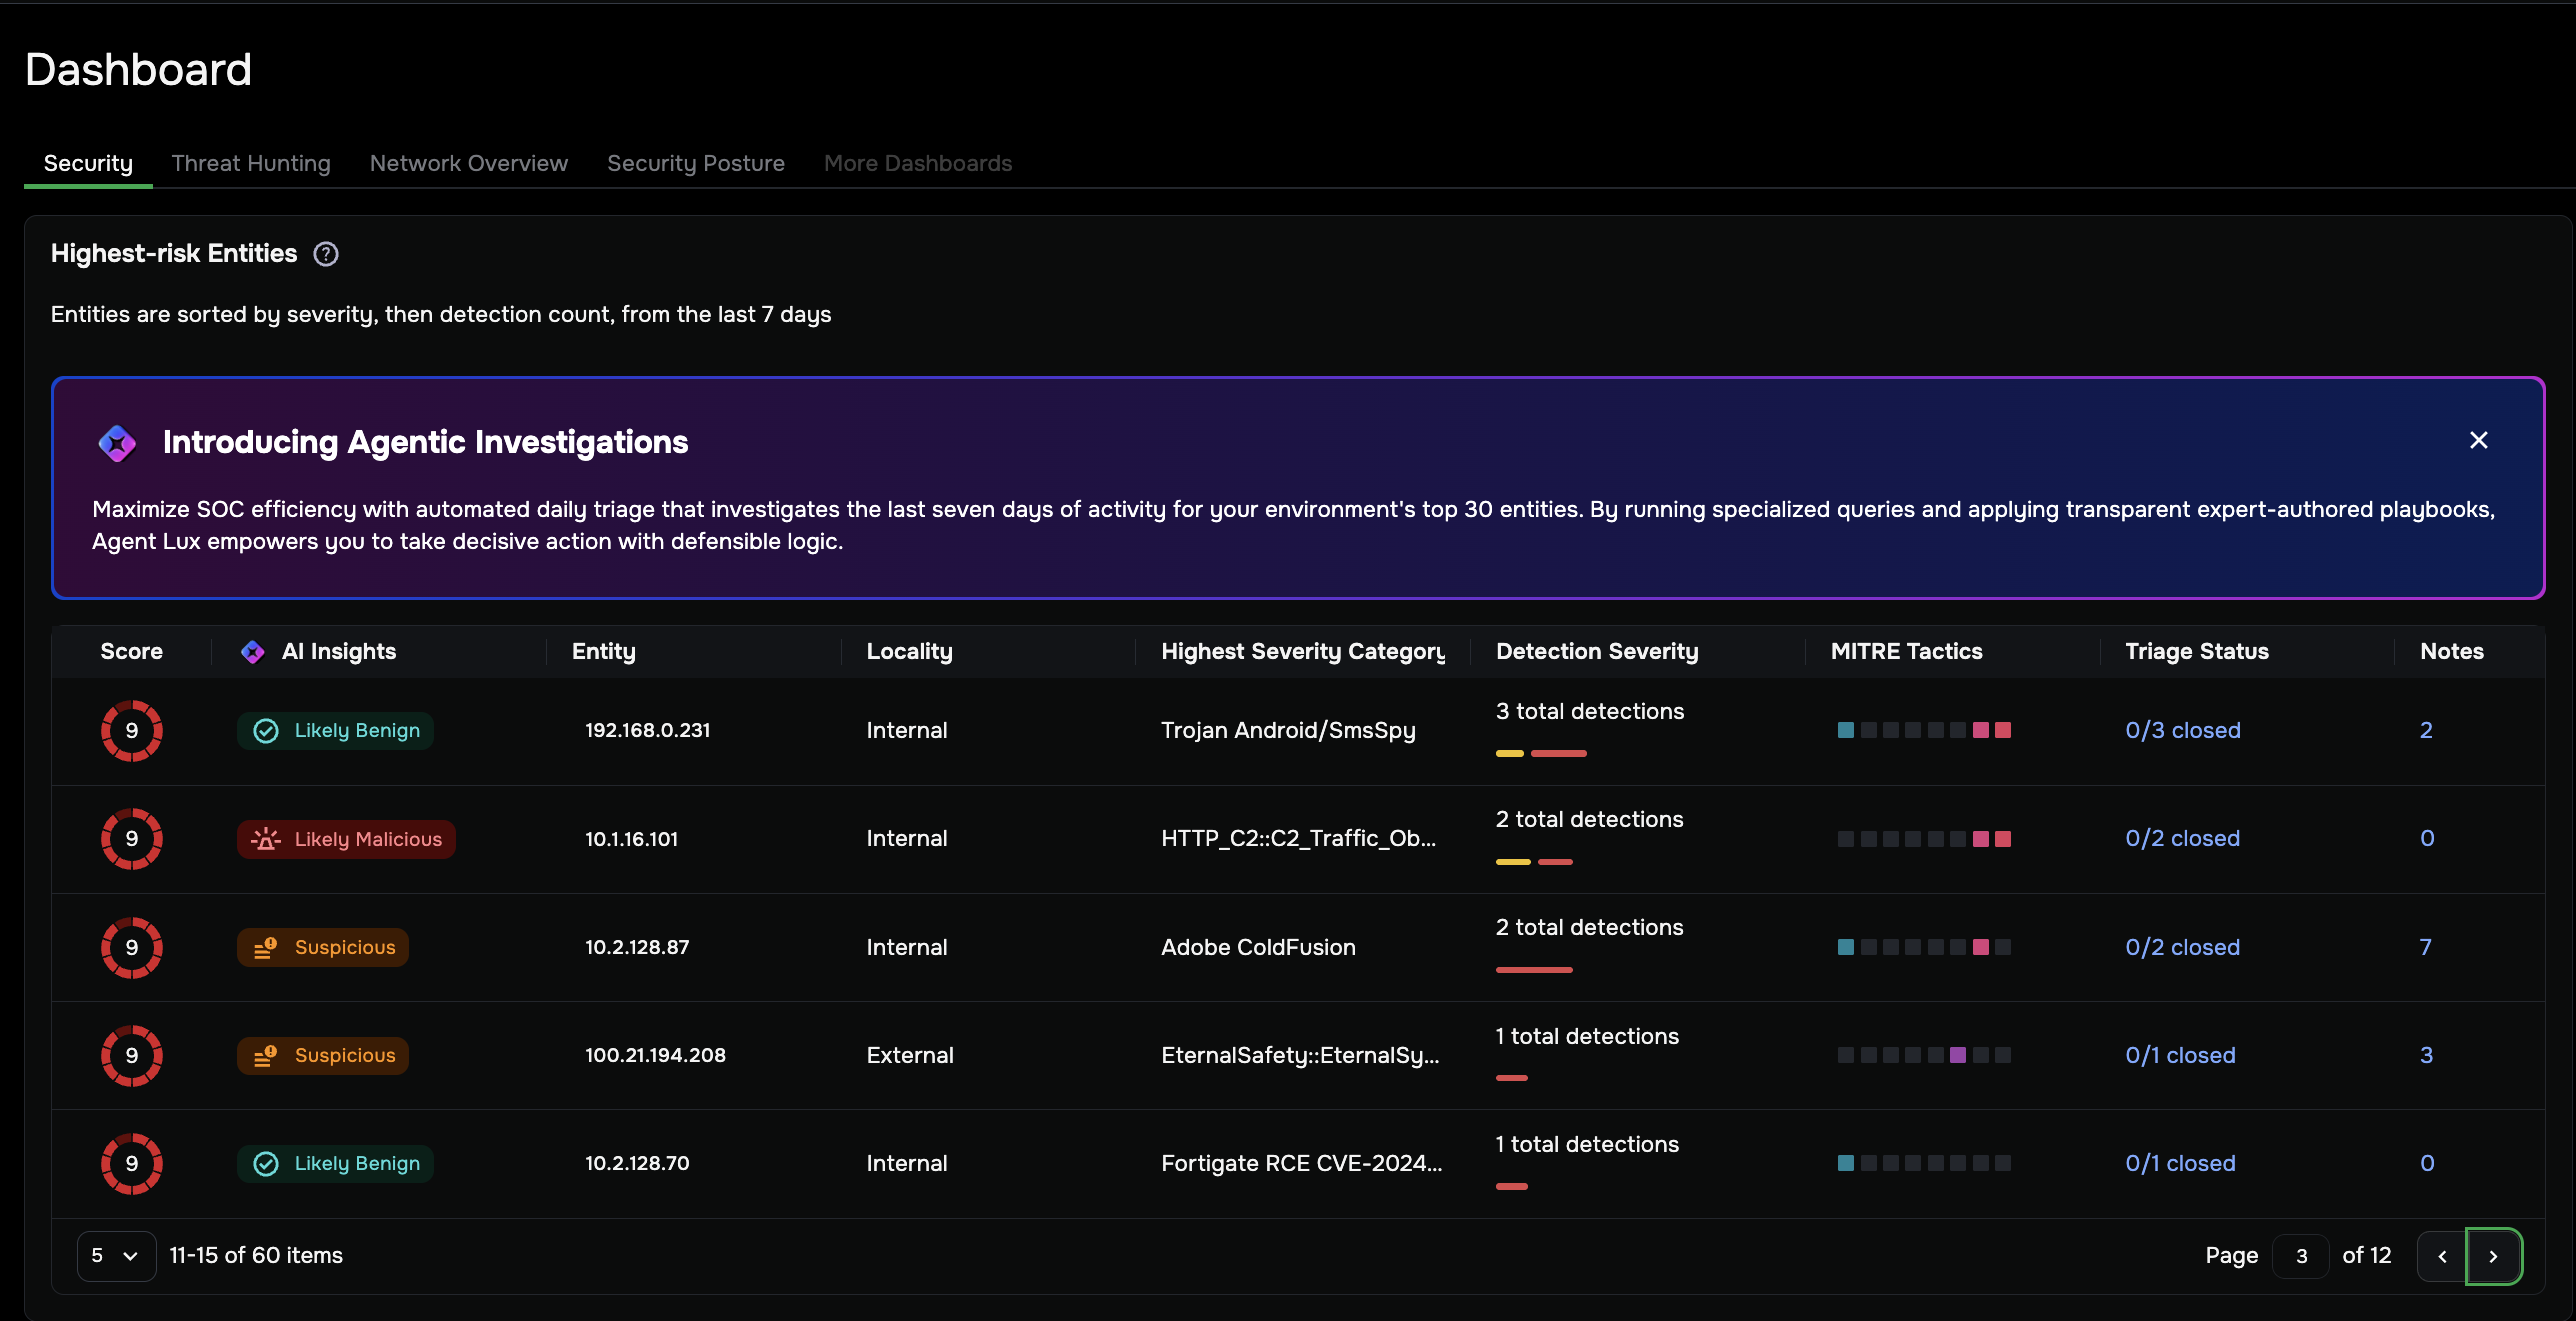
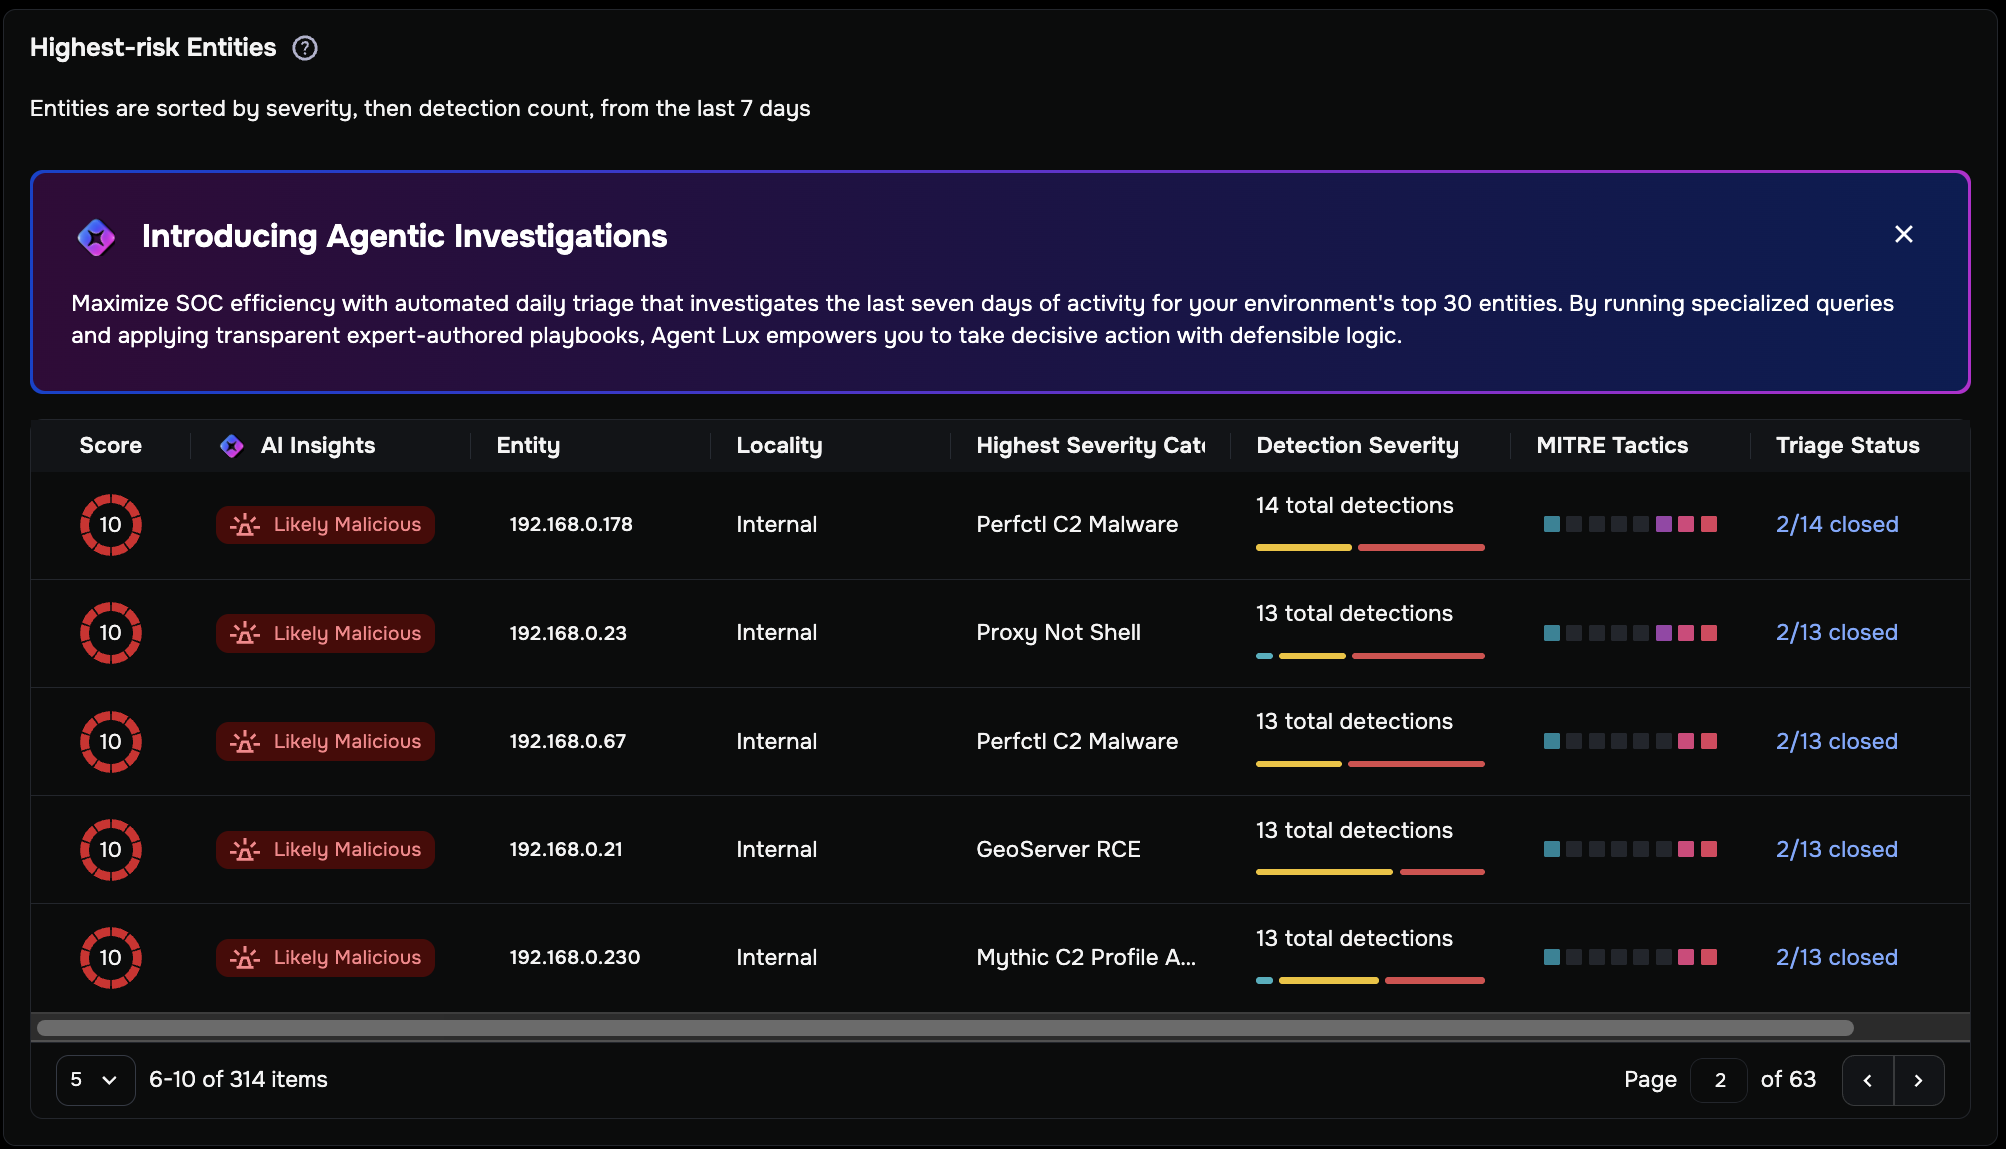
Located on the Security tab, the Highest-risk Entities panel is your primary workspace for daily triage. It automatically prioritizes network entities based on their risk score over the last seven days.
Understanding the Score
Entities are sorted by a triage confidence Score (1–10), which is determined by the highest severity detection verified on that entity. Use this score to determine where to start your day:
9–10 (Critical): Confirmed high-fidelity threats (for example, Ransomware, Command and Control).
7–8 (High): Needs Human Review behavior that requires further investigation to confirm successful exploitation.
1–6 (Medium/Low): Policy violations, low-fidelity detections, or benign anomalies.
Managing the daily top priority queue
When Agentic Triage is enabled, the system identifies the top priority entities every 24 hours by analyzing detection severity, the volume of alerts, and, most importantly, the open status of the detections.
To remove an entity from this automated cycle, you must manually close all of its open detections (updating the Triage Status). This ensures the AI doesn’t waste time re-triaging incidents a human has already addressed, keeping your queue clean and freeing the system to focus on new, emerging threats.
Highest-risk Entities panel reference
Use the data in this panel to quickly assess the threat landscape before drilling down into a deep investigation:
Column Name |
Technical Definition and Interaction |
|---|---|
Score |
A triage confidence score with a risk ranking (1–10) based on the highest severity detection verified for the entity. Click the score to open the Entity Overview. |
AI Insights |
(Requires Agentic Triage) A qualitative assessment verdict (for example, Needs Human Review or Likely benign) generated by the AI. Click this text to view the detailed investigation summary. |
Entity |
The IP address or domain of the device. Hover to view the Entity Summary Card; click to open the Entity Overview. |
Locality |
Identifies if the host is Internal or External to the network. |
Highest Severity Category |
Displays the name of the most critical detection category triggered by this host (for example, |
Detection Severity |
A visual bar chart showing the volume and severity mix of all detections for that entity. |
MITRE Tactics |
A heatmap indicating which attack stages (for example, Command and Control) were observed. |
Triage Status |
A ratio of Open vs. Closed detections (for example, “8/14 closed”). Closing all open detections removes the entity from the next 24-hour automated triage cycle. |
Notes |
The number of analyst notes or comments attached to this entity. |
Investigating an entity
Once you identify a priority threat on the Highest-risk Entities dashboard, you can investigate it using three distinct workflows, depending on the depth of analysis required:
Initial triage workflow: Use this for a quick, surface-level assessment directly from the main dashboard to determine if an entity warrants a deeper look.
Deep dive analysis workflow: Use this comprehensive path to read the full attack narrative, review the timeline, and plan containment actions inside the Entity Overview workspace.
Evidence verification workflow: Use this highly technical path to audit the AI’s step-by-step logic, inspect the raw JSON output, and transition to LogSearch to independently confirm the threat.
Note
User interface elements or steps marked with the [AI] icon require Agentic Triage. If you do not have this feature enabled, you can still investigate entities using these workflows, but AI-generated insights, summaries, and playbooks will not be visible.
Initial triage workflow
Use this workflow to assess entity priorities without leaving the main dashboard.
Locate the Entity: On the Highest-risk Entities panel, find the host in the Entity column to assess its status.
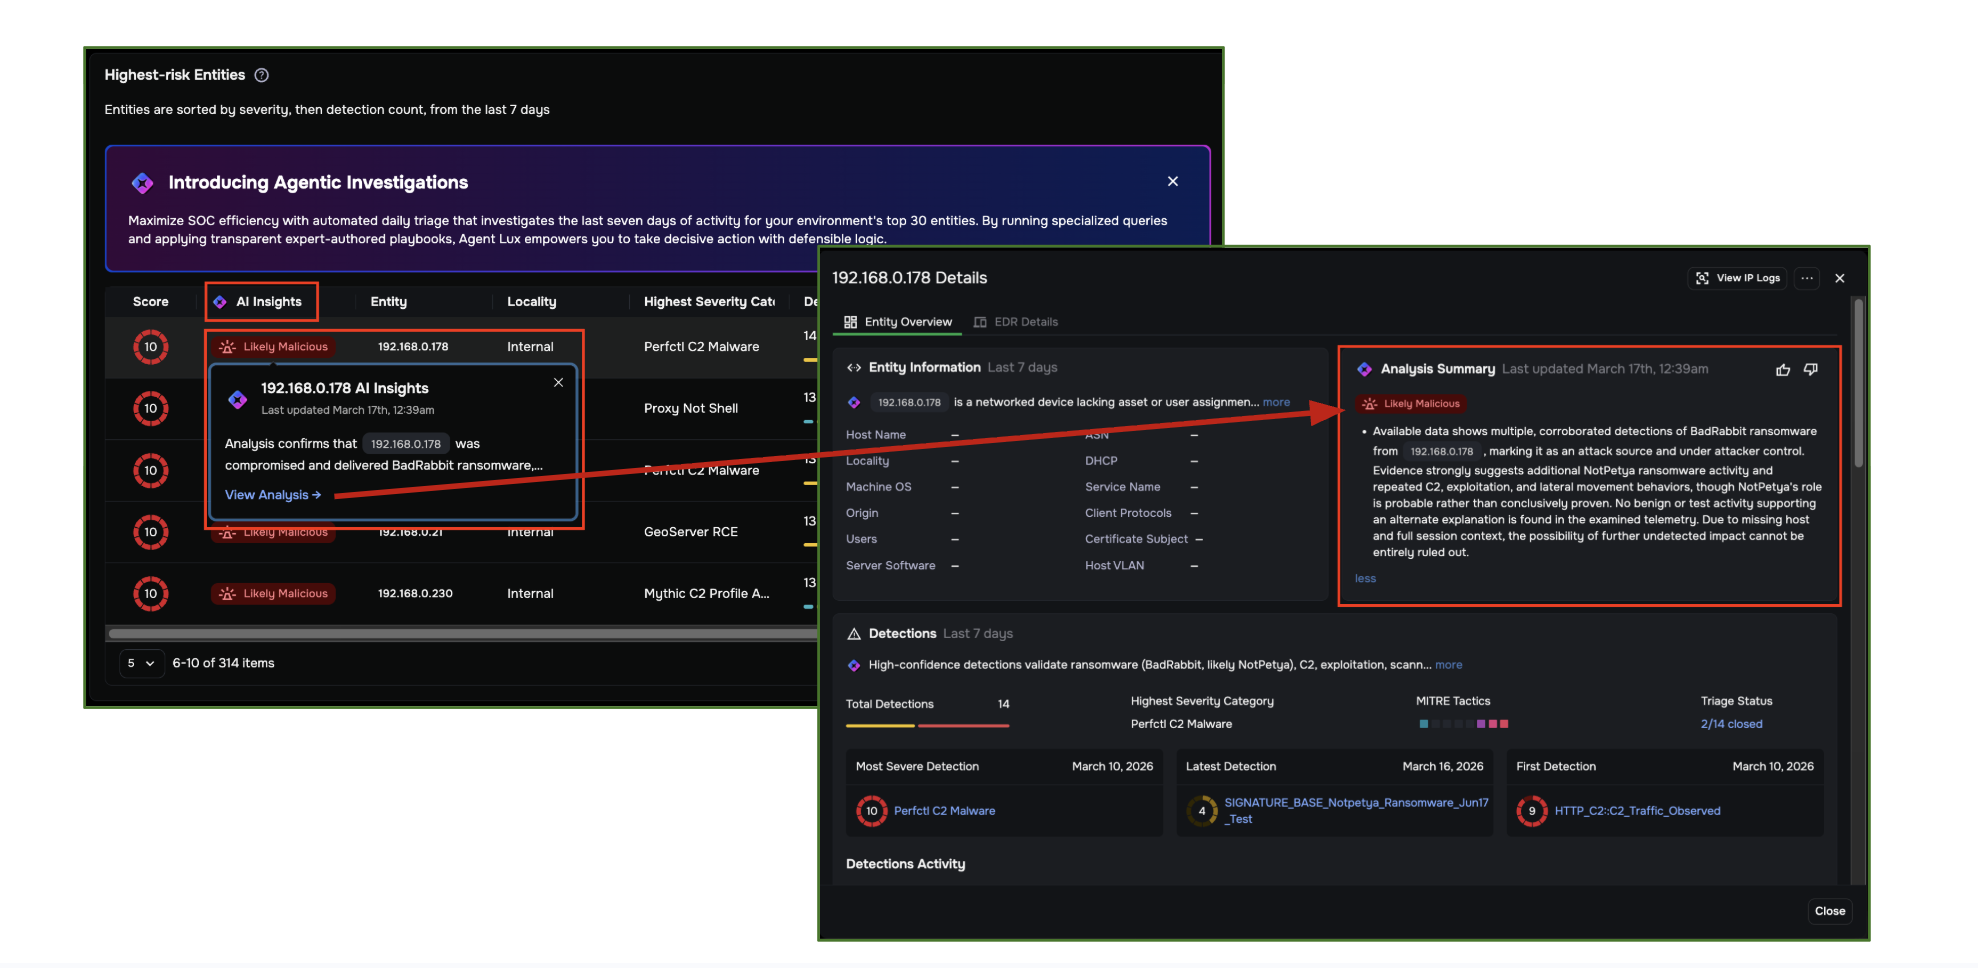
Assess the Risk: Hover over the IP address to open the Entity Summary Card overlay. This card surfaces critical details such as the number of detections, severity breakdown, and recent activity patterns to help you quickly gauge the threat level.
Review Core Evidence: Inspect the card for identity details (such as Origin, ASN, and Protocols) and the scrollable list of recent alerts to validate the threat. If the entity has been processed by Agentic Triage, use this data to verify the AI Insight verdict.
Determine Action: If the threat requires deeper analysis, click the Investigate button on the summary card (or click the entity’s Score or AI Insight text in the dashboard) to pivot to the full Entity Overview.
Deep Dive analysis workflow
Use this workflow to understand the full story of an incident.
Open Entity Details: On the Highest-risk Entities panel, click the AI Insights text (or the Score) for your target entity to open the Entity Overview tab.
Read the Narrative [AI]: Review the Analysis Summary panel for a plain-language explanation of the attack chain. This narrative connects individual detections into a cohesive story of the incident.
Check the Timeline: Use the Detections panel to identify the First Detection and the Most Severe Detection milestones. This helps you establish the duration and peak intensity of the compromise.
Review Confirmed Threats [AI]: Inspect the Investigation Findings panel for verified facts (for example, “Confirmed C2 Activity”) rather than sifting through raw alerts.
Plan Response [AI]: Review the Recommended Responses panel for a prioritized checklist of containment steps. This allows you to quickly identify the most effective actions to neutralize the threat.
Evidence verification workflow
Use this workflow to validate the agent’s findings by inspecting the raw network evidence and the automated logic behind its conclusions.
Open the Playbook [AI]: In the Investigation Findings panel, click View Playbook to see the checklist of steps the agent took. This playbook shows the investigative questions the agent asked and the logic it used to verify each finding.
Review Tool Output [AI]: Scroll to the Associated Evidence section to view the raw JSON output used to substantiate the finding.
Verify Source Data [AI]: Click the View in LogSearch button at the bottom of the evidence window to pivot to the raw packet logs. To verify that the AI has not misaligned or “hallucinated” data, use this pivot to expose the actual query execution. This shows you exactly where the data came from, how it was transformed, and how it was formatted before being rendered.
How to close a detection
To clear an entity from your top priority queue, you must close its associated detections. Closing all open detections for an entity removes it from the next 24-hour automated triage cycle. You can do this in two places:
From the Highest-risk Entities dashboard: Click the link in the Triage Status column (for example, “1/3 closed”) to open the slide-out panel, then click the Close icon for the open alerts.
From the Entity Overview: Scroll to the Detections panel and manually update the status of the open detections to “Closed”.
Entity Overview panel reference
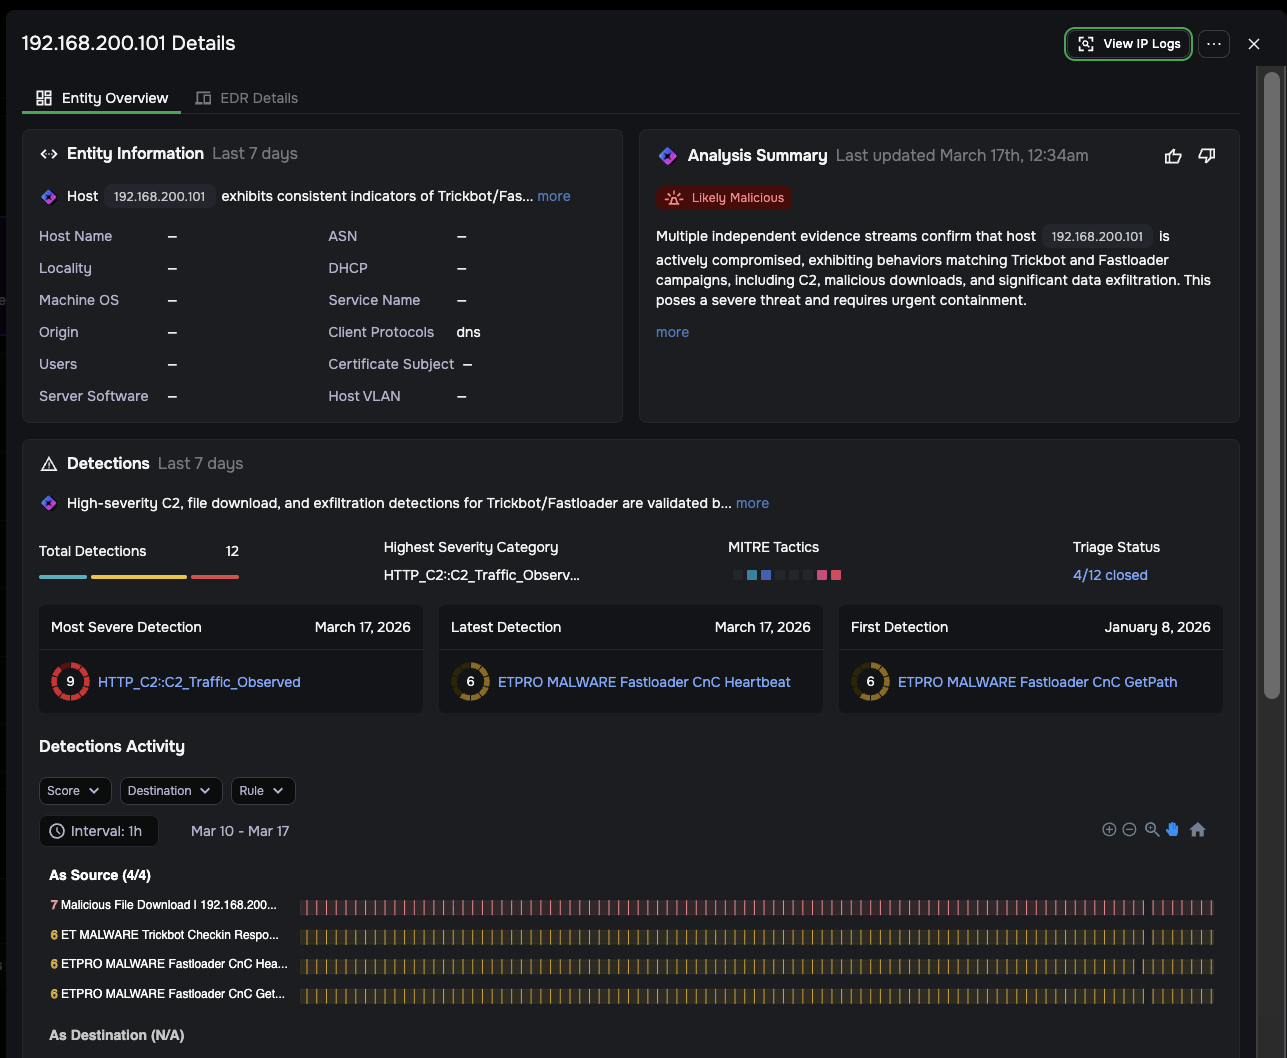
The Entity Overview tab serves as your primary investigation hub. Use this reference to understand the context provided by each panel.
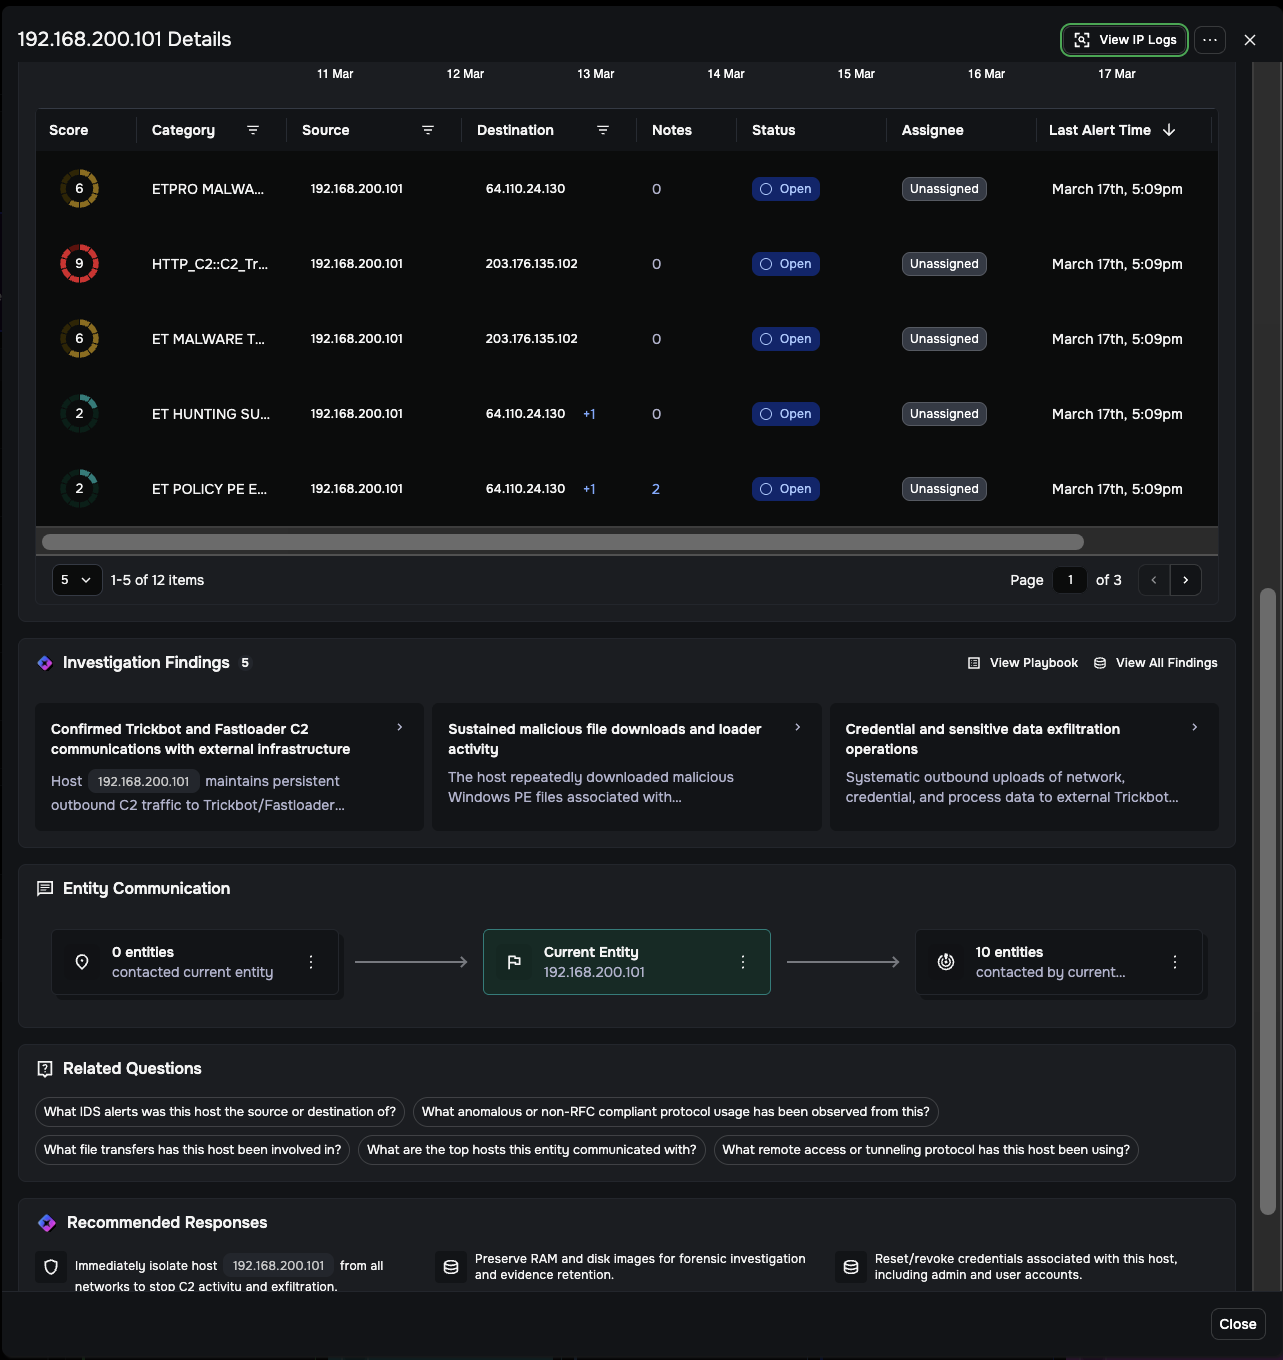
Panel Name |
Description and AI enhancements |
|---|---|
Entity Information |
Displays core technical details like Host Name, Machine OS, and DHCP data. [AI] Includes a plain-language summary of the entity’s compromise status at the top of the panel. |
Analysis Summary |
[AI] Provides a timestamped narrative of the attack chain with a risk badge (for example, “Needs Human Review”). Use the Thumbs Up/Down icons to provide feedback to the model (does not train model on private telemetry). |
Detections |
Visualizes attack duration, showing total detections, severity breakdown, and timelines for First, Latest, and Most Severe detections. [AI] Adds a one-sentence AI summary of the detection patterns. |
Investigation Findings |
[AI] Lists specific, evidence-backed facts that the AI has verified by autonomously checking logs. Click View Playbook to inspect the exact logic used. |
Entity Communication |
A directional flow diagram showing the volume of inbound and outbound connections for the current entity. |
Related Questions |
Context-aware investigation questions (for example, “What file transfers has this host been involved in?”) that instantly run complex LogSearch queries when clicked. |
Recommended Responses |
[AI] A prioritized checklist of remediation and forensic steps, such as isolating the entity from networks to block attacker access. |
Key Findings and evidence
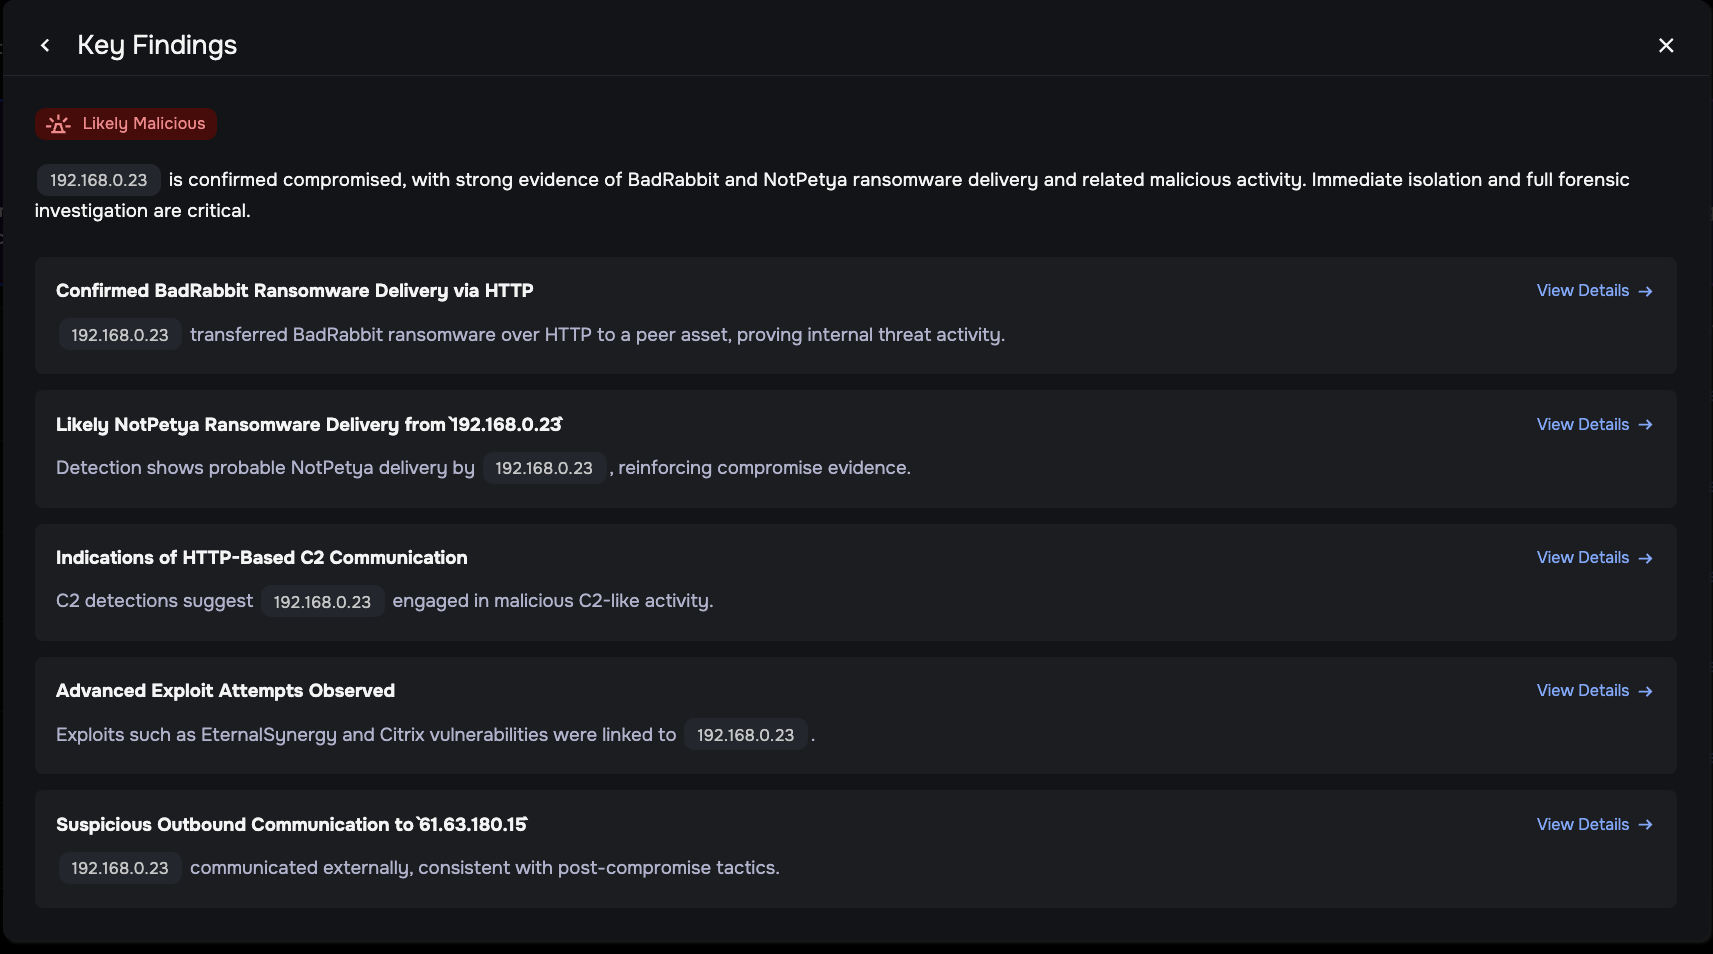
When investigating a high-risk entity, you can validate the agent’s conclusions by inspecting the specific network evidence and automated reasoning used to substantiate each finding
Inspect the Reasoning: In the Key Findings modal, click View Details on any finding to see the Associated Evidence. This displays the exact JSON data the AI reasoned over to reach its conclusion.
Verify the Source: Click View in LogSearch to see the actual query the agent executed to gather that specific telemetry.
Confirm the Facts: By viewing the raw logs, you can independently confirm that all AI findings are based entirely on actual network traffic rather than generated assumptions.
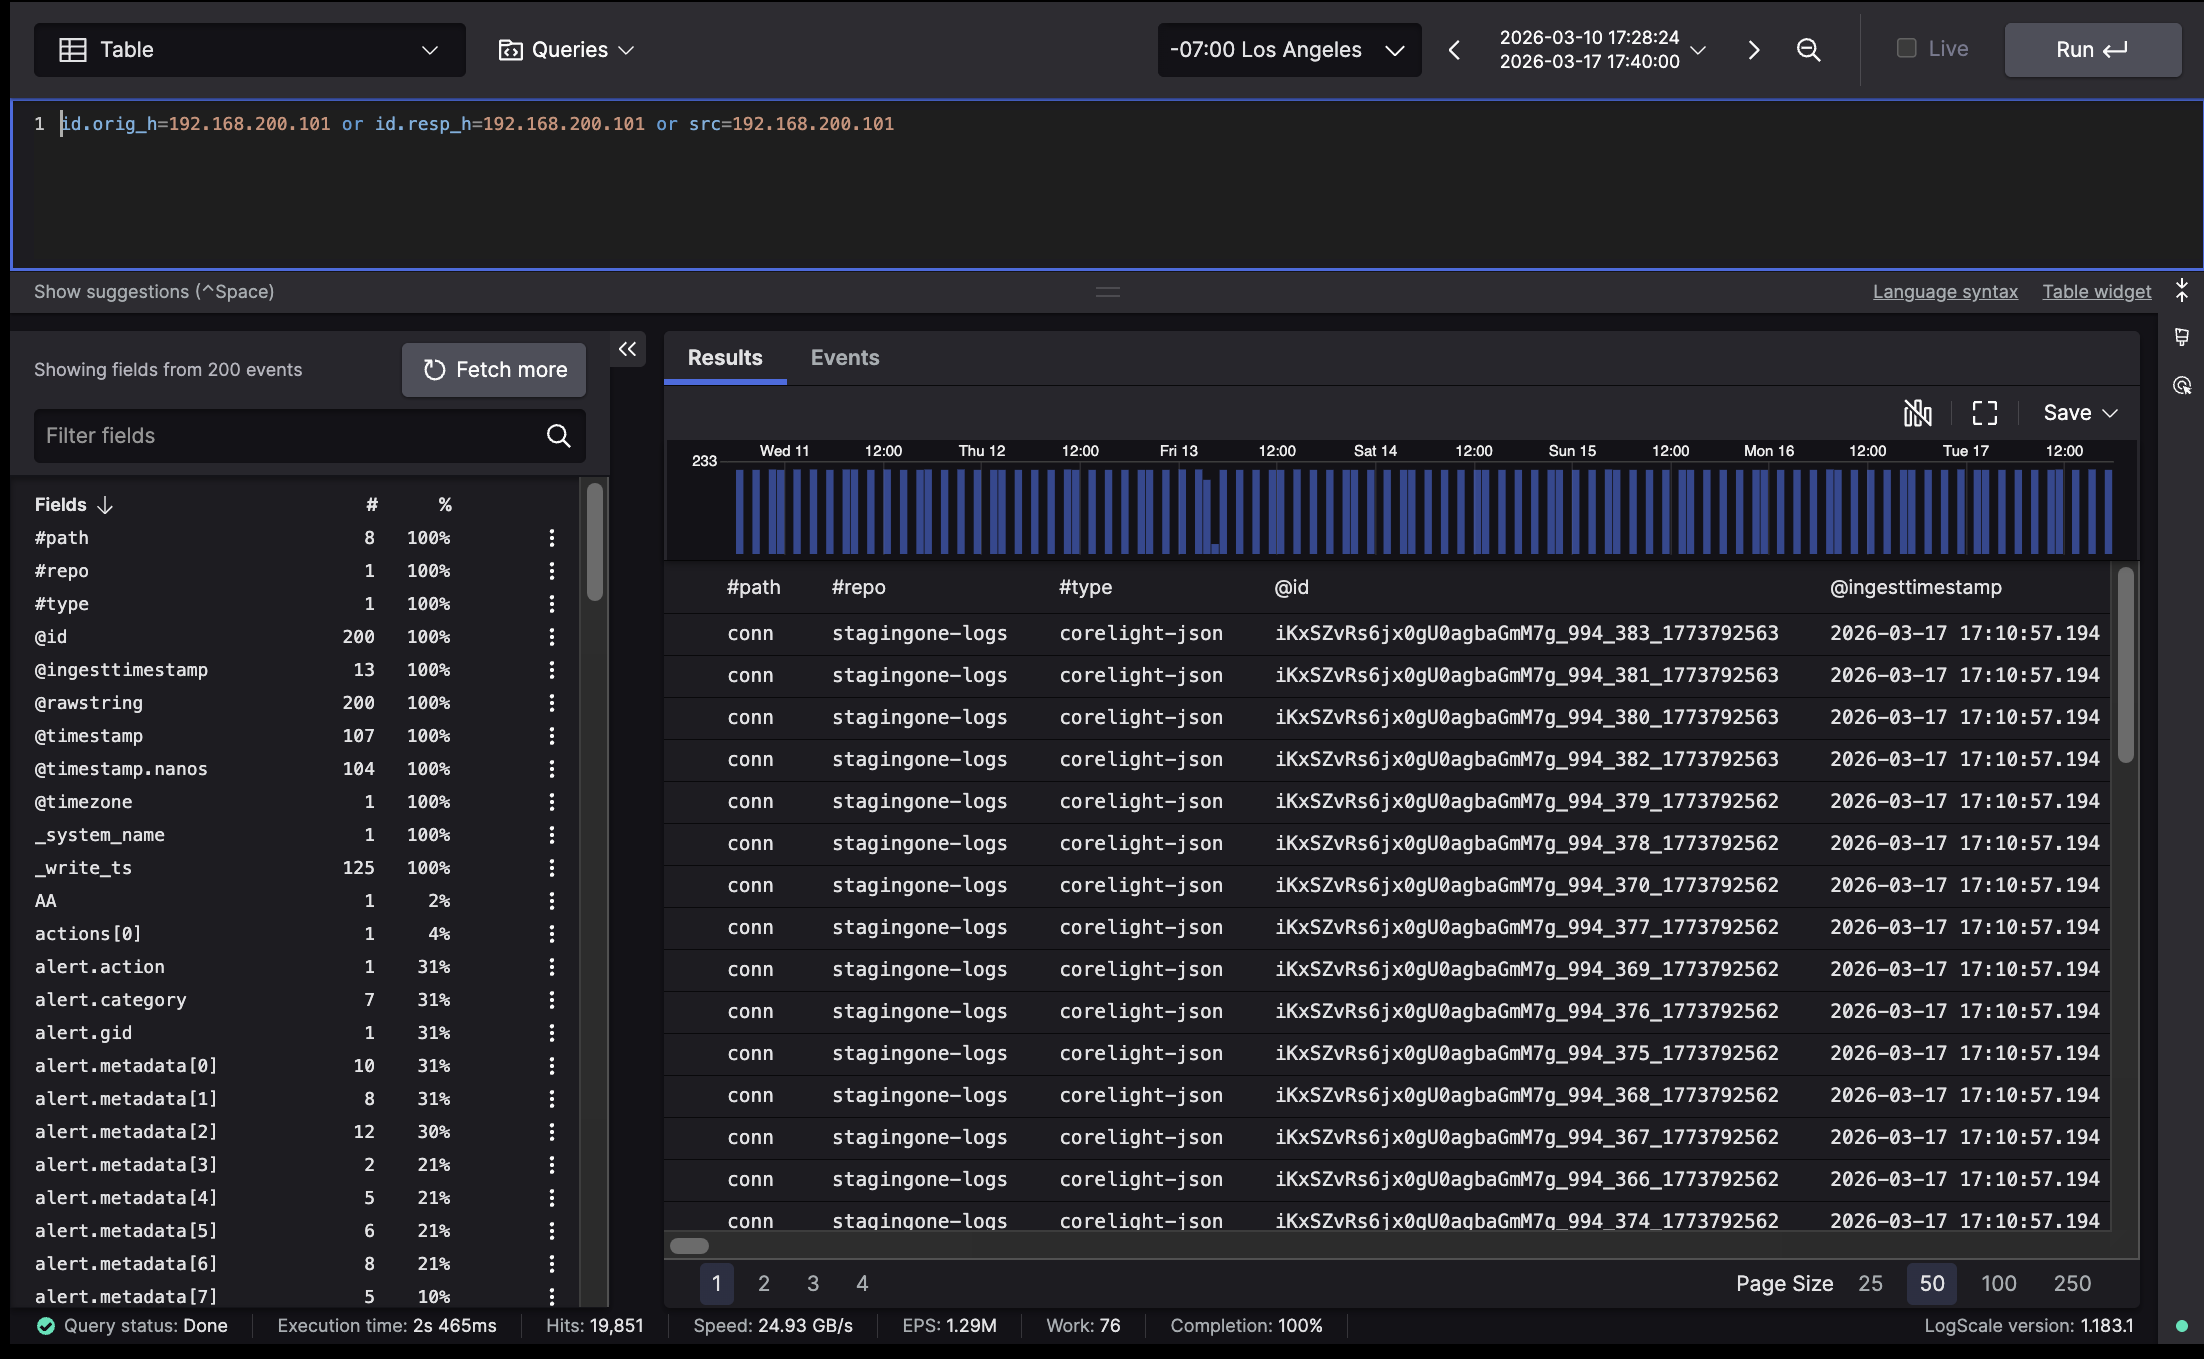
Accessing raw network logs
Click the View IP Logs button in the top-right header of the Entity Overview. This executes a pre-filled query for the entity’s traffic, allowing for deep forensic analysis without manual query writing.
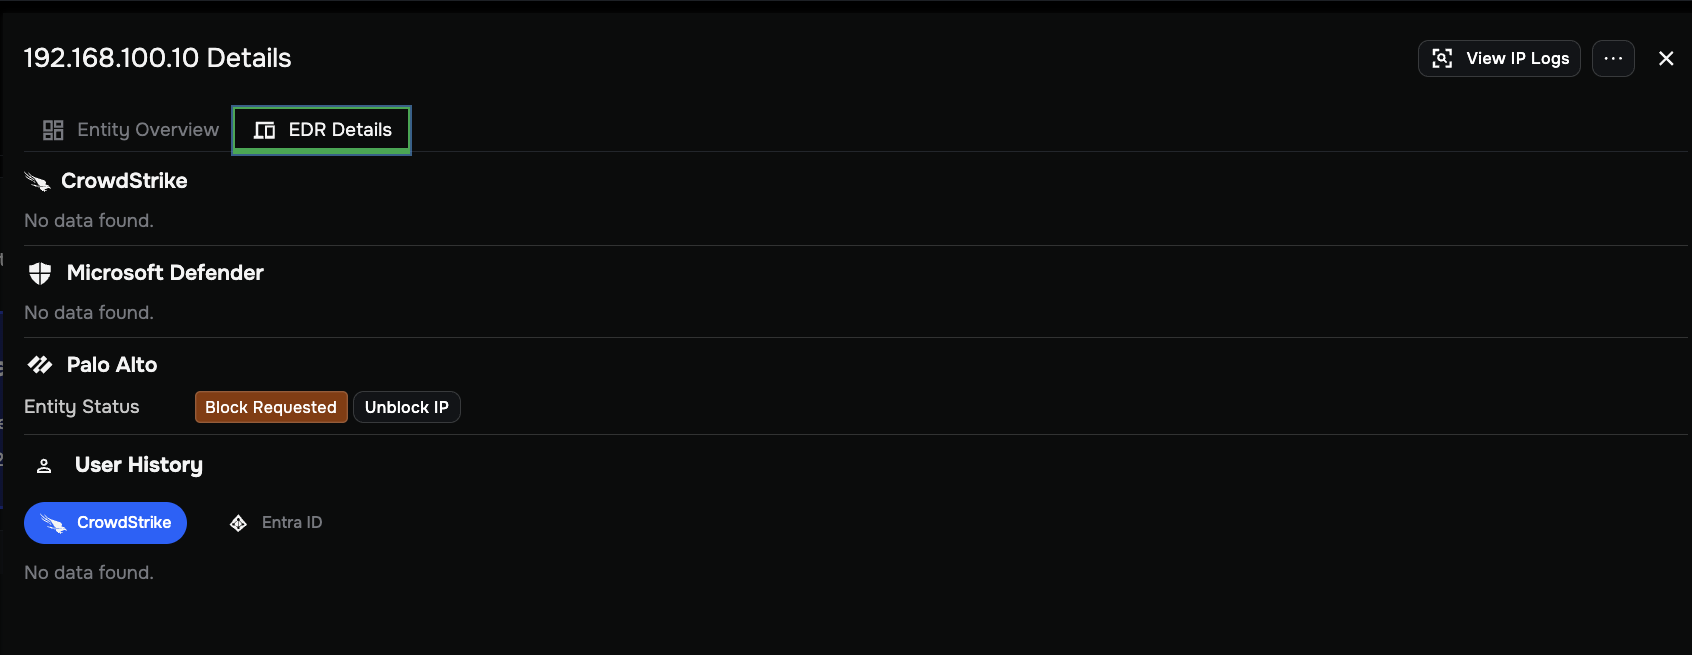
EDR Details and response actions
The EDR Details tab provides real-time context from platforms like CrowdStrike or Microsoft Defender.
Vendor Integrations: View real-time connectivity of endpoint platforms.
Entity Status: Check if a host is Normal, Isolated, or Compromised.
Response Actions: Execute remote commands like Block IP or Isolate Host.
Common scenarios and troubleshooting
Why is an entity missing from the top priority list?
Check Score: Its score may be lower than other candidates for that 24-hour period.
Review Triage Status: If all detections are closed, the system excludes it.
Verify Integration: Ensure the GPT (Private data) integration is enabled.
How do I handle a “Needs Human Review” false positive?
Provide Feedback: Click the Thumbs Down icon (does not train model on private telemetry).
Verify Logic: Use View Playbook to see the cause of misclassification.
Clear the Queue: Close the detections or Suppress the entity.
When should I pivot to LogSearch?
Forensic Depth: To inspect raw packet payloads.
Custom Hunting: When Related Questions don’t cover your hypothesis.
Final Validation: To confirm a response action successfully terminated traffic.
What happens to closed detections?
Once you close a detection, it is moved to the Triage Status history. To prevent dashboard noise, the automated pipeline will not re-investigate those specific historical detections, ensuring the agent focuses entirely on new, emerging activity during the next daily run.